INTRODUCTION
Climate change is one of the challenges of the century, causing a global increase in average temperatures and changing the environment from which we get our resources (IPCC). The cause is the increase in the emissions of greenhouse gases (GHG) driven by decades of human changes in the landscape, mostly, for the use of agriculture and human occupation in a constantly growing population (Bindoff et al. 2013). This land-change associated with an increase in GHG emissions, have been affecting tree growth throughout the whole planet (Malhi et al. 2009).
Tree growth is driven by a combination of water, sunlight availability and ideal temperatures for optimal enzyme function (Boisvenue and Running 2006). Increase in temperature no only affects tree function but also reduces water availability due to increased evapotranspiration. Thus, places in which tree growth is water-limit may be subjected to dieback or reduced growth (Boisvenue and Running 2006; Allen 2009) (Figure 1). A global analysis of heat-induced tree mortality revealed more than 80 dieback events throughout the world related to drought events – some events had over a 1M hectares of affected areas (Allen et al. 2010). Also, the increasing demand for food, timber and biofuels creates a pressure in the industry sector to covert forest areas to pastures and croplands, increasing deforestation and further contributing to GHG emission (Putz et al. 2008).
Tree growth is driven by a combination of water, sunlight availability and ideal temperatures for optimal enzyme function (Boisvenue and Running 2006). Increase in temperature no only affects tree function but also reduces water availability due to increased evapotranspiration. Thus, places in which tree growth is water-limit may be subjected to dieback or reduced growth (Boisvenue and Running 2006; Allen 2009) (Figure 1). A global analysis of heat-induced tree mortality revealed more than 80 dieback events throughout the world related to drought events – some events had over a 1M hectares of affected areas (Allen et al. 2010). Also, the increasing demand for food, timber and biofuels creates a pressure in the industry sector to covert forest areas to pastures and croplands, increasing deforestation and further contributing to GHG emission (Putz et al. 2008).
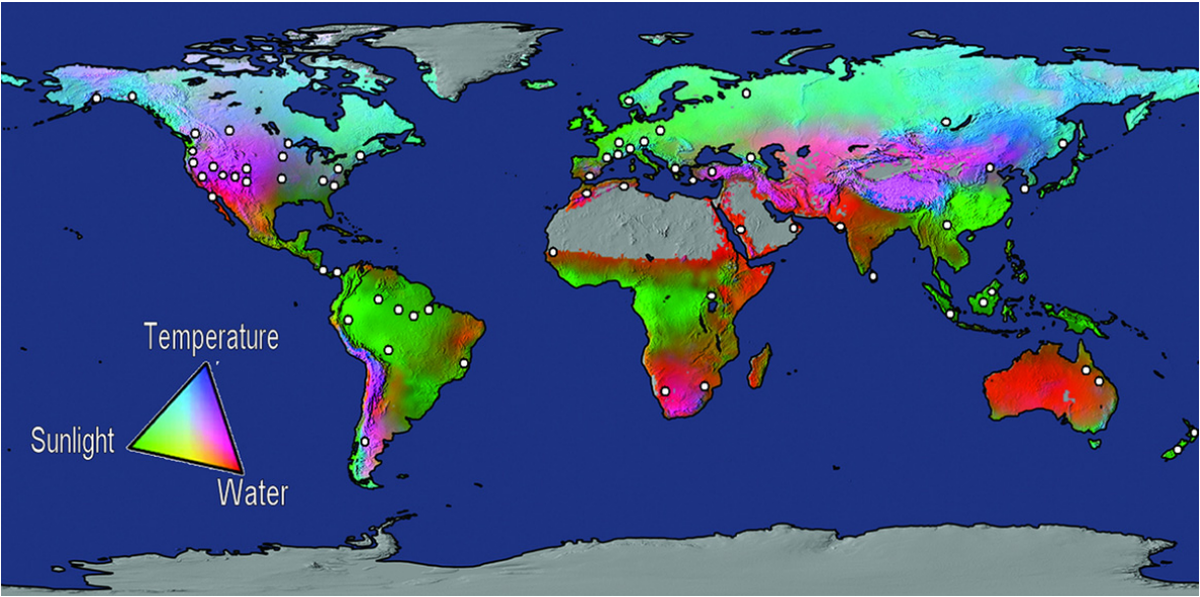
Figure 1. World map produced by Boisvenue and Running (2006) demonstrating growth limiting factors on different regions of the world. Points plotted by Allen et al. (2010) represent diebacks events linked to drought and heat.
Since land-use and climate are changing at unprecedented rates, species won’t be able to adjust to the new conditions, ultimately causing large events of dieback or large shifts in vegetation patterns (Malhi et al. 2009; Field et al. 2014). Therefore, the ability to predict how species will respond to future changes in climate is essential to understand how we should manage the landscape (Field et al. 2014).
We can make such predictions using information stored in tree-rings (Chen et al. 2010; Speer 2010). In trees, each ring correspond to the amount of growth in a single year, it is possible to correlate this information with climate data for several decades to obtain an average tree response to environmental conditions (Cook and Kairiukstis 1990). This can inform what factors limit growth for a certain community or species and can help fill an important knowledge gap regarding species threshold to drought (Allen et al. 2010). Since these responses may vary according to species or regions it is imperative to understand how trees respond locally in order to assess impact of future changes in climate and propose measures for mitigation or even assisted adaptation (Gray et al. 2011; Field et al. 2014) (Figure 2).
We can make such predictions using information stored in tree-rings (Chen et al. 2010; Speer 2010). In trees, each ring correspond to the amount of growth in a single year, it is possible to correlate this information with climate data for several decades to obtain an average tree response to environmental conditions (Cook and Kairiukstis 1990). This can inform what factors limit growth for a certain community or species and can help fill an important knowledge gap regarding species threshold to drought (Allen et al. 2010). Since these responses may vary according to species or regions it is imperative to understand how trees respond locally in order to assess impact of future changes in climate and propose measures for mitigation or even assisted adaptation (Gray et al. 2011; Field et al. 2014) (Figure 2).
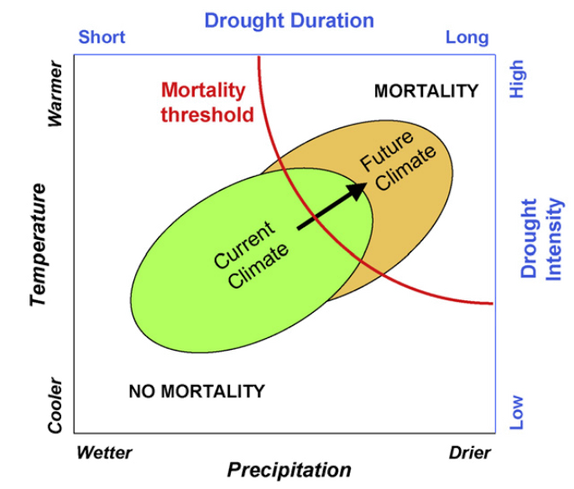
Figure 2. Conceptual diagram from Allen et al. (2010) demonstrating the relationship between precipitation and temperature or, alternatively, drought duration an intensity correspondently. The current variability in climate (green circle) is predicted to shift towards drier and warmer moving to the upper right corner. A great part of future climate variability is predicted to cross the mortality threshold and increase dieback events.
Although this type of study started while ago in the 1900s, several countries are yet to take advantage of such analysis (Speer 2010). For South America, the still incipient use of such techniques as well as its great tree biodiversity pose a challenge to make predictions for this area (Speer 2010; Amoroso et al. 2018). Tree-ring databases provides an advance for such analysis, supporting studies on a variety of regions and environment types that harbor important diversity of species (Amoroso et al. 2018; Zhao et al. 2018). South America contains large forests of local and global importance with a vast species biodiversity, however, little tree-ring information is available on tree-ring databases (e.g. ITRDB). For South America, tree-ring information from Argentina and Chile comprise most of the dataset demonstrating a lack of this type of analysis for the rest of the continent (Speer 2010; Amoroso et al. 2018). Lack of information on how trees respond to climate change may lead to poor land management, sudden landscape changes (e.g. from dieback) and reduced resources for future generations (Allen 2009; Malhi et al. 2009; Steinkamp and Hickler 2015).
Our study focused on understanding what environmental factors limit tree growth using the available South America dataset. We take advantage of the response function analysis to understand how trees respond to variations in temperature and precipitation. Since the studied area is predicted to have increased temperatures of around 0.2-0.45 °C, and 10-12% less precipitation (Magrin et al. 2014), the outcome of this research is to identify how vulnerable the communities/species are to changes in climate and thus how vulnerable they are to projected changes in climate (Figure 3).
Our study focused on understanding what environmental factors limit tree growth using the available South America dataset. We take advantage of the response function analysis to understand how trees respond to variations in temperature and precipitation. Since the studied area is predicted to have increased temperatures of around 0.2-0.45 °C, and 10-12% less precipitation (Magrin et al. 2014), the outcome of this research is to identify how vulnerable the communities/species are to changes in climate and thus how vulnerable they are to projected changes in climate (Figure 3).
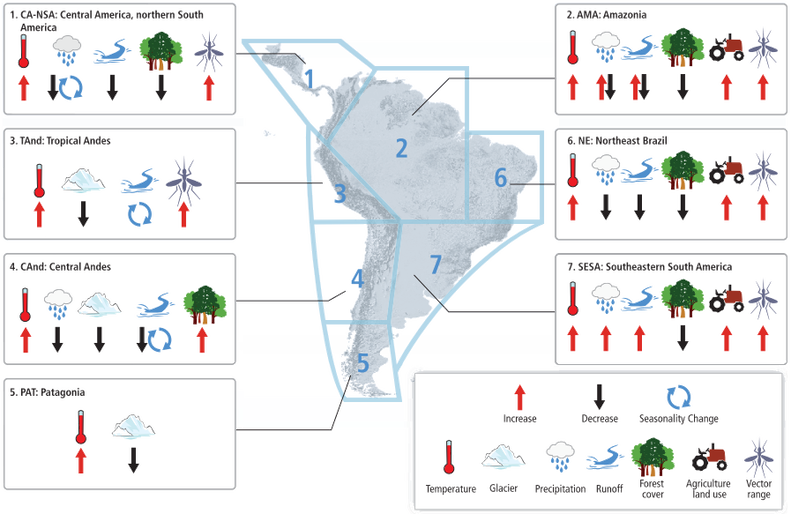
Figure 3. Conceptual map from the working group II of International Panel of Climate Change (Magrin et al. 2014). Note that areas 4 and 5 are predicted to increase in temperature and have a retreat in glacier. Area 4 is also predicted to have reduced precipitation, runoff and increased forest cover. It is important to highlight that Increase in forest cover might occur for a few better adapted species and could shifting species composition towards less biodiversity.
We wish to answer the following questions:
1. How do chronologies differ in their response to climate?
2. What are the limiting factors for tree growth in South America?
We hypothesized that species under similar environmental conditions would share similar responses. They could thus be managed together based on their geographical location. However, it is possible that within the same climate, species occupy different niches and thus may respond differently to changes in climate. This would imply that species should be managed according not only to their environmental conditions but also based on their specific responses to these conditions.
